Textual Analysis:
The Journals of Lewis & Clark
1804-1806
Introduction
For my midterm project, I worked with The Journals of Lewis and Clark, 1804–1806 from Project Gutenberg to explore what their writing reveals about the expedition. I analyzed it using Voyant, created a Dreamscape map and word cloud, and ran some frequency analyses in R Studio to see how often certain words appeared and how that varied between Lewis and Clark. Together, these tools helped me see what each author emphasized and how their language reflected different parts of the journey.
Source
The dataset for this project comes from The Journals of Lewis and Clark, 1804–1806 by Meriwether Lewis and William Clark, downloaded as a plain text file from Project Gutenberg. I manually cleaned the file by removing the Gutenberg material at the beginning and end, then further processed it using an R script. This script converted all text to lowercase, removed punctuation and common stopwords, and used the name-and-date format at the start of each entry (for example, “[Lewis, April 25, 1806]”) to separate the text into sections by author and date.
It is important to note that the original misspellings, inconsistent spacing, and other textual quirks are still present in this file.
Visualizing with Voyant Tools
Process
I used Voyant to explore the cleaned text of The Journals of Lewis and Clark. After removing the Gutenberg heading and tail, I uploaded the file directly into Voyant. From there, I generated a Dreamscape map to visualize geographic references and created a word cloud to highlight the most frequently used words. The results were then embedded below to show the patterns and places that stood out in the journals.
Word Cloud
Here, I embedded the HTML code generated by Voyant directly into my website’s subdomain. This made it easy to display the visualization interactively. The results were interesting but not especially surprising: the largest word was “river,” followed by terms like “morning,” “evening,” “deer,” “indians,” “water,” “horses,” “creek,” “mountains,” and “wind.” These reflect the explorers’ daily observations and focus on their surroundings. One limitation of this approach is that the original misspellings and inconsistent wording likely affected the frequency counts, so similar words may have been treated as separate entries. Even so, the word cloud still gives a pretty clear snapshot of what filled their days and writing during the expedition.
DreamScape Map
I embedded the Dreamscape map from Voyant directly into my website using the HTML code provided. The map highlights the geographic references mentioned throughout the journals, showing the explorers’ movements and locations they described most often. While it was interesting to see these patterns, nothing was particularly surprising, as it largely reflects the known route of the expedition. One potential limitation is that place names with misspellings or inconsistent formatting may not be fully captured or could be counted separately, which can slightly distort the geographic patterns. Still, the map provides a visual sense of the journey and the locations that occupied Lewis and Clark’s attention in their writing.
Analysis with R Studio
Process
I used R to explore word frequency patterns by author and season in the journals. The script first separated each entry based on the name-and-date headings (for example, “[Lewis, April 25, 1806]”), which allowed me to assign each entry to the correct author and date. Then, I converted all text to lowercase, removed punctuation and stopwords, and preserved the original misspellings. After tokenizing the text into individual words, I calculated the most frequent words for each author and visualized them with bar charts. I also analyzed trends across seasons to see which words appeared most often at different times of the year. This approach complements the Voyant word cloud by showing patterns in a more structured, data-driven way while still reflecting the character of the original journals.
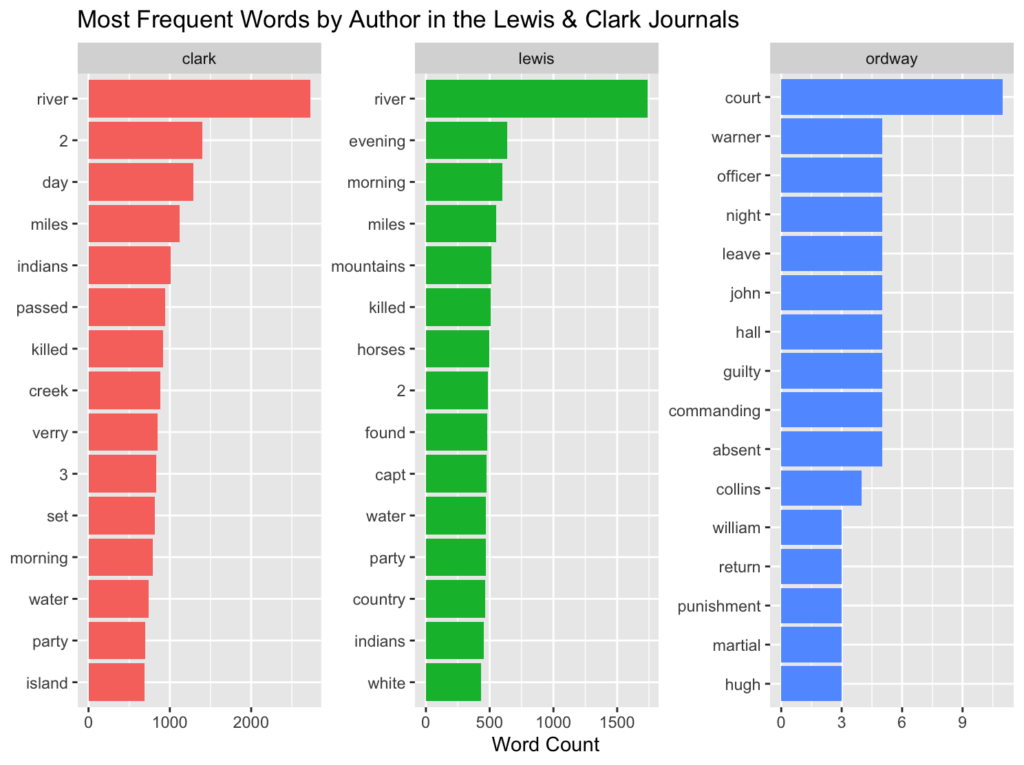
Word Freqency by Author
I shared the word frequency graph by embedding it as an image. The graph
shows the most common words used by Lewis, Clark, and Ordway, highlighting
interesting differences in their focus. Lewis and Clark’s entries were
generally similar, with “river” appearing as the dominant word, reflecting
their focus on the landscape and daily activities. Ordway’s entries, by
contrast, emphasized terms like “court,” “officer,” “punishment,” and
“guilty,” reflecting his role as third in command, responsible for
provisions, guard duties, and keeping official records. One limitation of
this approach is that misspellings and other textual quirks may have
affected word counts, but overall the visualization clearly shows the differing perspectives and responsibilities among the three authors.
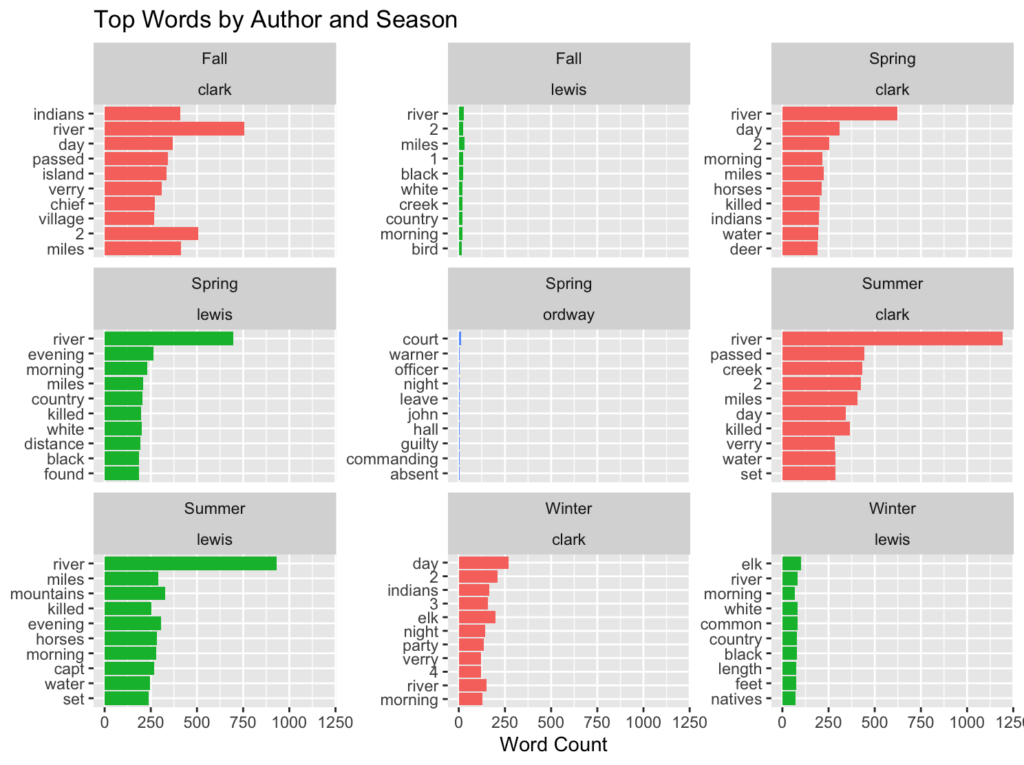
Top Words by Season
The seasonal word frequency graph was embedded as an image. Lewis and Clark consistently emphasized natural features and daily life, with
“river” dominating in fall, spring, and summer. Fall entries also
frequently included words like “island,” “indians,” “horses,” and “village,”
while spring emphasized “river,” “killed,” “indians,” “water,” “deer,” and
“horses.” Summer entries highlighted “water,” “creek,” “horses,”
“mountains,” and “river.” Winter differed more noticeably, with “night,”
“party,” “morning,” “river,” “elk,” “natives,” and “white” appearing most
often. While this seasonal breakdown provides insight into how the
explorers’ experiences and observations changed over time, again,
misspellings and textual quirks may have slightly affected counts, and
shorter-term patterns within months are not captured. Still, the
visualization effectively shows how the journals reflect both the
changing environment and the expedition’s activities across the year.
Conclusion
By applying textual analysis and digital visualization tools to The Journals of Lewis and Clark, this project highlights patterns in language, focus, and perspective. The word clouds, Dreamscape map, and R analyses make it easy to compare the authors’ emphasis, track seasonal differences, and see how their experiences and roles shaped their writing. While the results may not be surprising in a historical sense, the digital approach allows for a more systematic and visual exploration of the text. This project demonstrates the value of Digital Arts & Humanities methods: rather than just producing statistical models or predictions like in data science, it emphasizes interpretation, narrative, and context, using computational tools to enhance our understanding of historical texts and the stories they tell.